I dare to say this might be one of my favorite projects. It is a combination of two projects I have done before, plus Desmos, of course.
Our school started off this second school year of Covid by saying we were not going to do Midterms. Then, in October, we were told to do midterms in January. Then, at our Jan faculty meeting, we were told because so many students were absent before December break and they would have work to make up, it would be okay if we did not do midterms. Well, I already had a lot of time and effort invested into my compromise of a Midterm Project, I did it and I am glad I did. I told my students a little bit about it before December break to get them interested - created the hook. I also told them it would happen the first three days back to school in January. There was nothing they had to do to prepare - no studying, so do not worry about math over break.
When we were told to do midterms in October, I came up with the idea to combine two projects I have done in the past. One was an idea from Alex Overwijk shared and it was to create parabolas by rolling marbles in paint and then rolling them on a tilted surface. This is done using the back side of wrapping paper that has the 1 inch graph on it. I did this years ago with one small class. It was messy, but fun. Then, for a few years, I did an Angry Birds project that had the students working in groups of 4 and each got some information about their own of four Angry Birds. They had to graph them in order to figure how who hit each pig and which bird went the highest and which one was in the air the longest. Students liked that one as well.
So, I thought, if I have the kids roll the marbles through paint to create the path of 4 different colored Angry Birds, then they can enter this data into Desmos and have Desmos do the regression to give us the equations, that would be pretty cool. This is all happening in four of my College Prep Algebra 2 class. We just finished a big quadratics unit, so we have done all the vocabulary, graphing, solving, and word problems. This would hopefully tie it all together nicely. Then, I was wondering how I could bring the pigs into it to take it further. I thought if each group had 2 pigs to place on their graph that would be fun. I found some really cute pig stickers on Amazon. At first, I thought I would give the students the options of placing their pig stickers before or after their roll. I tried rolling a marble through the paint on the titled board and it worked. I was pretty good at it. But, I realized, it would be quite challenging to actually get the wet paint, rolled marble to go through the pig. I made the decision to have them place the pigs AFTER they painted all four paths. I decided I wanted them to place the pigs on the bird's path down. During the project and as I was seeing how the kids rolled the marbles, I decided that it did not need to be on the way down because their up part of the parabola was more perfect. Some of the marbles lost their umph and went up nicely but then came down in a straight line.
Before I could make this all happened, I knew I had to figure out how to make it work in Desmos so we had a place to collect the data and the project. Could I figure out how to have them enter all their data (5 points from each path) and then get it into Desmos for Desmos to do the regression? I am a Desmos Fellow and have attended their headquarters. I was trying to learn the coding behind Desmos, but I have not had enough time to spend with it. I played around a little bit with it, but I just couldn't do it. So, I reached out to Jennifer White, on Twitter, whom I know from Desmos and Twitter Math Camp. I sent out an SOS, explained my crazy idea, and she jumped right in. She thought it could work and it would be visually nice to have all four colored coded tables on one slide and then connect it to the next slide that would have the regression and graphs. She did up a mock Desmos Activity Builder activity with the coding for one table. She was amazing! From there, I played with it, copying and pasting to get it to work for the other three tables. I tried entering some data and I could not get it to show up on the graph. I kept trying. At this point, I wasn't sure I was going to be able to get it to work, and therefore, the project might not happen. Jenn originally had the table of values containing four points. I decided I wanted the students to enter five points each, the two x-intercepts, the vertex, and 2 other points. I asked a student in my Accelerated Algebra 2 class to help me and look at the coding. He noticed one subscript was off. I thought that was it, nope. Then, in talking it through with him, I realized when I added another data point, I didn't change the coding. I added that in and voila, it worked! Okay, we were doing it!
I put out a call to the parents in town on Facebook asking for donations of wrapping paper with graphs on the back. My friend and my mother in law reached out and gave me all the rolls I needed. I ordered two sets of pig stickers. I have four classes of Algebra 2 with about 20-25 students, so about 90 students total. I decided to have them work in groups of 3 like we do when we work in the board groups, and for the most part, I allowed them to choose their partners. I did not think I could pre-arrange the groups because I did not know who would be absent due to travel or covid. I had to put a few groups together too but the kids were okay with that. I have 2x2 whiteboards that the students would tape the graphing paper to to have a hard surface to work on. This meant I needed to cut out 32 2x2 pieces of the wrapping paper. That took me about 1.5 hours to cut. That was ready. I collected yard sticks and Sharpies to draw and label the axes with. I finished writing up the activity all in Desmos including the plan. I estimated three days would be good for the project. Hopefully we could get all paint done on the first day and collect the five points from each of the four parabolas, and we did. Then, on the second day we could look at our graphs and equations in Desmos and do the PIG math. We would place the two pig stickers. This is where I extended the idea of the pigs. I thought, if they know the coordinates of each pig, then, we could actually prove the bird hit the pig. With the first pig, they could tell me which bird hit it and then they could plug X into the equation and solve for Y. Not too tough, straight calculation from standard form. Then, for the second pig, they could plug in Y and solve for X. A little more challenging, but it built the need for the quadratic formula. And, that meant working through the formula with a lot of crazy decimals. My students like nice, clean numbers, aka, integers, but nobody complained about the decimals. I think it is because I have used a lot of Deltamath this year and the numbers aren't always nice, so they have learned how to round and enter their answers in Delta because they want to get it correct. For both of the pigs, we were aiming to get close to the other X and Y values and we did! There were some kids that were off by a lot. It may have been because they place it on a parabola that curved up correctly, but then, rolled straight down. Some groups chose different points, and therefore, had different equations, but they were trying to do all the math with the same equation. We learned the difference between the A value being -20 and -2.0. We learned that negatives and decimals ARE important. We did already know that because they opened down, all the A values should be negative, but this confirmed that. We learned that doing the Quadratic formula on your phone calculator is really hard.
Day 1: The room set up:


Okay, back to the beginning. Day 1: I set up my room. I pushed the desks to the perimeter of the room. I put the desks in groups of three so they could walk in and choose a spot and their groups. I had all my supplies out: 2x2 whiteboards, wet wipes, paper towels, and rags (any way to clean up the paint), kid friendly paint I bought on Amazon (colors: Red, Orange, Green, and Blue - to work in Desmos), marbles, 4 trays with four bowls each, yard sticks, Sharpies, 4 wooden triangles that I have in my room for decoration that the students would lean their boards against on the floor, 4 cut open trash bags to catch the messy, painted marbles, and a recording sheet. I told everyone they were responsible for their completing their own Desmos activity and their own recording sheet that would be collected. Along my planning path, I thought we could use a recording sheet, just a front and a back with a screenshot of the 4 tables in Desmos because it is easier to collect points on paper and then enter them into Desmos. I also had the students take the 4 equations from Desmos and write them on their recording sheet so they could use it for the PIG math. On the back, was an explanation and space to do the 2 PIG math problems. Tell me the coordinates of each pig and the color and equation of the bird that hit the pig. Then, solve for X with one and solve for Y with the other. I added that I wanted them to take a picture of their work and upload it to Desmos. I have to say the recording sheet and the Desmos worked really well together. They didn't have to have their computers on their desk the whole time. On day one, they took a 2x2 whiteboard and taped their wrapping paper graphs to it. Then, they used a Sharpie and a yard stick to draw Quadrant one, label their X and Y axis with numbers and words. X as time in the air in seconds and Y as the height in feet. I made a mistake in that in one place in the Desmos direction, I said to label X as distance, so I clarified that. After they drew their graphs, they set up at one of four stations on the floor and I gave them one clean marble to practice rolling. We learned you should be in front of the board and not the side. You don't really want to throw it up but more in a North-East direction to get it to roll down the board correctly. The kids did great and they really had fun with it. With four stations and 7 or 8 groups each, we had plenty of time to get all the groups to roll 4 painted marbles each. That meant I didn't have to set up the paint stations the next class. After they rolled their artwork, they untaped it from the 2x2 boards and taped it to a vertical board around the room so they could collect 5 points from each path onto their paper and then enter into Desmos. This is on screen 9. Then, when they went to screen 10, that was when I could celebrate, it worked! There were their 4 paths, almost just like their pictures. I explained to the students that with the help of a friend online, I was able to code Desmos to take our data, run a regression (I never taught them regression), and then graph our paths. I also told them the part I could not figure out was the color coding. The tables each say red, orange, blue, and green, but it didn't really correspond to their actual paths. So, I worked with each group when they got to this point. (I should add I have a teaching assistant in each class, except for one, so that was helpful.) I showed them how to go to the gear and change their colors. This was a built in need to learn how to change the colors and now they will have that for their future Desmos use. Some students even got to the point to write down their equations from the Desmos regression onto their recording sheet. I asked them to round to 1 or 2 decimal places. They did not need the approximation squiggle or the x1 subscripts. And, we stopped there and I knew it would all work out and be worth it. I went into the project thinking, this is either going to be really great, or it is going to flop. Either way, it will be memorable. I am happy to report, it was really great.
The first rolls:
Board directions:
Rolling in a group:
After the paint rolling:

Day 2/3. We got further than I predicted on Day 1 which was good news and then, two of my four classes were to finish this up on Friday (today) but snow was predicted. Snow, travel, covid, nothing can stop us! So, I worked with those two classes to make sure we were in a place that they could finish up on their own should we have a snow day (and we did, that is why I am able to finally type all this). My original plan for Day 2 was to enter the data into Desmos, get the equations, and do the PIG math. Then, on day 3, they would do the analysis and the reflection parts. It was easy to combine those in. For my first two classes, I did see them all three days and we did it that way. On day 2, we did the PIG math. I should them examples on the board and then they were off. It was quite a bit of work to get around to help everyone with these two big calculations and it did take most of the period, but they did it. Some groups ran into negatives under their square roots. They were so cute and even thought to put i in their answers. I suggested we keep it real. Their discriminant might have been -0.2 so we called it zero and went from there. I did have a group with a discriminant of -303 and I realized they entered their data wrong, so there were these situations but they all rolled with it (pun intended). Once they got their math done, they took a picture of each problem and uploaded that to Desmos (took a little bit of help with file forms and such). That is where I stopped with my first two periods in order to save the analysis and reflection for day 3, but with my other two classes, I squeezed it in and asked them to finish it for homework. It is their midterm project, so I know they will do it.
Day 3: Analysis and reflection: I asked, "Which bird went the highest and how high?" and I fixed my second question to ask, "Which bird was in the air for the longest amount of time and how long?" Then, I had them answer a reflection piece:
Tell me what you thought of this project. Elaborate on the following questions. How did it tie in with our Quadratics unit? Do you understand everything that went into the project? If not, what did you not understand? How well did your group members work together? Would you have preferred a midterm exam? What could make this project better? What was your favorite part of this project?
This is the piece I am looking forward to reading through. One student started off the project by asking how it was going to be graded. I said, "This is an example where it is more about the process than the project. If you complete the project, you will be all set." That is what they needed to hear. No studying, no preparing, no homework each night, just doing the project in class and coming up with a really cool thing at the end, even working through messy numbers. They did it and I am so proud. I remember, I woke up early on Monday, first day back from December break, because I was excited to get to see how it would all go. After literally months of thinking about it in my head, it would finally come out on paper. I haven't had the opportunity to be that excited about something new in a while or to create something in a while. It felt good and I am so glad I did it. It was a lot of time to prepare, a lot of materials to collect and buy, a lot of out of cost expense to me, but all in all, it was worth it. I think the kids will remember this one.
And, finally, they had to upload a picture of their final artwork into Desmos so they would have it all in one place. Nice job everyone! Now, to enjoy the Snow day. Thanks for reading.
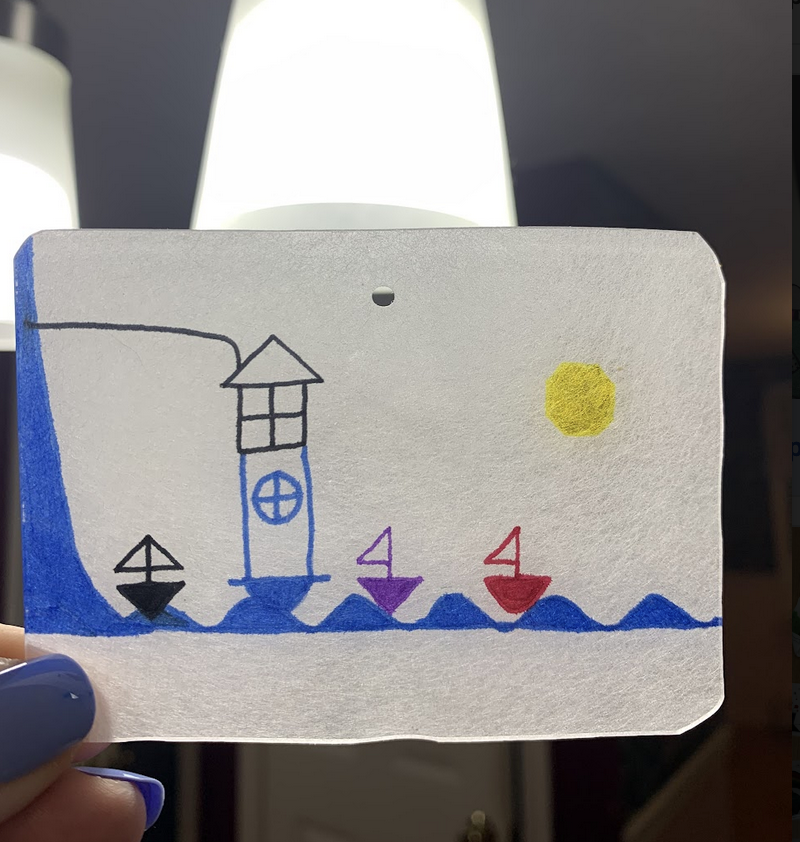
We aren't supposed to play favorites, but I think this one came out the best:
Desmos: Angry Bird Game Design Midterm Project
Angry Birds' Recording Sheet
Class google slides: Day 1, Day 2, and Day 3
And, a big thank you to everyone that made this possible: Alex O, Jenn W, my friend with the wrapping paper, my mother in law, Amazon, my 3 teaching assistants, Desmos, and my students.
And, finally, some screenshots of their reflections pieces:
Thank you! (That took me 1.5 hrs to type)